Logging: Structured, Centralized, and Searchable
Structured logging, log levels, centralized logging, and log aggregation: how a distributed fleet turns scattered events into one searchable record; the pillar that answers "what exactly happened?"

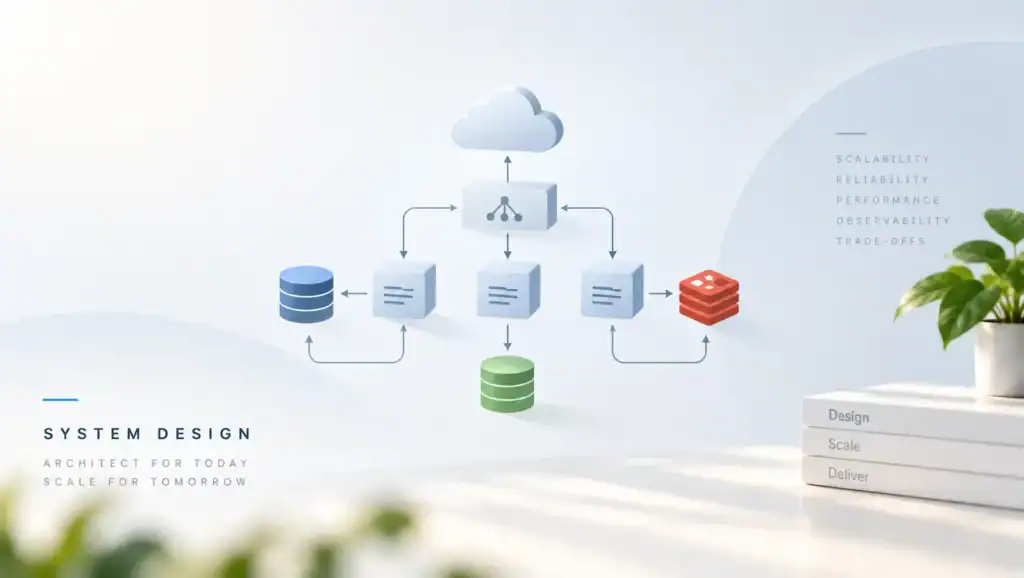
Structured logging is the practice of writing each log entry as a record of named, typed fields (timestamp, severity level, service, message. The request’s identifying context) instead of a free-form prose line. That a fleet’s logs can be indexed, filtered, and joined by machine rather than read and grepped by human.
The boundary with the hub stays as the overview drew it: that page owns the vocabulary, the pipeline’s four stages. The single comparison table that says which pillar answers which question. This page owns the record itself, how it is written, what severity means, how it travels, and what it costs to keep. The sibling line is just as firm: metrics owns the aggregates that watch the fleet, distributed tracing owns one request’s causal journey. The log owns the individual event in full detail; the only pillar that can answer “what exactly happened here, in this instance, at this moment?”
What is structured logging
As a result, the unstructured habit is the default everywhere: a print statement with a sentence in it (“User checkout failed, weird”) timestamped by whatever wrote it. Prose lines are readable by the author, on the day written, in the service that wrote them. They are also unjoinable: no field says which request, which tenant, which shard; every later analysis is regex archaeology, and every regex is a guess at what the author meant. One service’s prose is a nuisance. A fleet of fifty services’ prose is a fog.
Structured logging fixes the shape of the record before the first line is written. Each entry is a record of named fields: timestamp and level and service on every line, plus whatever context the event carries: request_id, user_id, order_id, latency_ms, status, shard. The message is a field among fields, not the whole record. The common wire shape is a JSON object per line, because that is what every shipper, indexer, and query engine already speaks. The shape matters more than the syntax: named fields, consistent names, machine-parseable from day one.
How this plays out in practice
What the shape buys is everything the rest of the pillar depends on. Filtering by field (“show me every checkout where status was declined and latency_ms exceeded two seconds”) is a query, not a grep. Joining across services (every line that carries the same request_id) reconstructs one journey without reading a single line of prose, which is the same discipline saga steps apply to events and event flows apply to subscribers. Aggregation, alerting, and retention policies all key on fields, because the aggregation pipeline downstream cannot see anything else.
In contrast, the discipline that keeps structure honest is a schema: agreed field names, agreed meaning, agreed types. A fleet where one team logs user_id and another logs userid and a third logs customer has three unstructured formats wearing a costume. And the schema has a security boundary baked in: log the identifiers, never the payloads: no passwords, no tokens, no card numbers, no raw request bodies. The record is meant to outlive the incident, and it cannot do that if it is a compliance liability. What is excluded is as much a part of the design as what is included.
Log levels and what they actually cost
The level taxonomy is a settled convention, and its value is that it is a contract with the reader. TRACE: the finest-grained flow detail: a request’s every step, emitted for one debugging session and off otherwise. DEBUG: developer diagnostics; state snapshots, decision branches, the lines a maintainer wants when reproducing a bug locally. INFO: business-significant events: an order completed, a config applied, a node joined, the record of normal life. WARN: something unexpected but handled: a retry succeeded, a fallback served, a deprecated field arrived; the system coped, and someone may want to know it coped.
ERROR: an operation failed and something needs attention. FATAL: the process cannot continue, the crash on its way out. Six words, and the whole taxonomy is a claim about audience: TRACE and DEBUG are for the author, INFO is for the operator’s log of normal life, WARN is a footnote for the curious, ERROR and FATAL are for the person being paged.
As a result, the first cost nobody prices is level inflation; the fleet where everything unusual is an ERROR, because the author felt strongly about it. Severity is not passion; it is a routing decision. An ERROR that requires no human judgment should not be an ERROR. Somewhere downstream a dashboard is counting error rates, an alert is firing on their sum. A canary ramp is aborting on their trend, the levels feed metrics that make shipping decisions. Misfiled levels are not a style problem; they are a fleet-wide signal corruption problem.
Trade-offs worth weighing
The fix is the contract stated plainly: ERROR means “a human should look.” If no human needs to look, it is not an ERROR.
The second cost is the production-DEBUG trap. Verbose levels are invaluable in a local reproduction and ruinous at fleet scale; every enabled line is I/O on the critical path, allocation in the hot loop, and volume in the shipping bill. The standard practice is dynamic level control: a per-logger level that can be raised or lowered at runtime without a redeploy. A fleet can run quiet in steady state and turn TRACE on for one misbehaving service during an incident, then turn it off again, which is the part that takes discipline.
In contrast, the third cost is the WARN swamp: warnings that nobody triages, accumulating at a rate nobody checks, each one plausibly fine. A WARN that no one will ever read is a DEBUG line wearing a costume; it costs the storage without buying the attention. The honest policy is triage on a schedule: warnings get reviewed, resolved, or demoted. An unreviewed warning stream is a fleet training itself to skim past its own early signals. Levels are cheap to write and expensive to honor, and the honoring is where the value lives.
Centralized logging
Logs are written where the work happens, on the instance, next to the process, into whatever local file or stdout the platform provides. Debugging happens somewhere else: the incident spans services, the question arrives at 3 a.m. from a page that names no culprit. The instance that saw the failure may already be gone. Centralized logging is the answer to that geography: every service ships its records to one queryable place. The fleet gains a single point where “show me everything about this request” is one query instead of a tour of fifty machines.
The architecture is deliberately boring. Each service writes to stdout or a local file: synchronous, bounded, and never itself a dependency on the network. A shipper, a per-host agent, tails those outputs, batches what it reads, and forwards to the central tier; the application’s critical path ends at the local write, and everything after that is asynchronous. The central tier indexes the fields the schema named (timestamp, level, service, request_id) and keeps the raw line for the query that asks for prose.
Failure cases to expect
As a result, query frontends then do the obvious: filter by field, join by request ID, and save the searches that recur.
The shipping layer is where reliability questions concentrate, and they are the same ones the rest of the fleet already answers. A shipper that drops records on a bad day loses exactly the evidence the bad day produced. Shipping is at-least-once with local buffering (the delivery-guarantee vocabulary message queues own) and the reader side tolerates duplicates the way idempotent consumers do: a repeated record is a nuisance, a missing one is a hole in the incident’s story. The API gateway earns its “richest observability point” title here too: it sees every call cross one tier.
Its access log (one structured line per request) is often the first place an incident’s shape becomes visible.
Log aggregation and the economics of keeping everything
Log aggregation is the pipeline’s middle name: collecting from every shipper, normalizing the fields the schema promised, enriching each record with what the source could not know (which zone it ran in, which deploy was live), writing it to durable storage. Indexing enough of it to make the query patterns fast. None of it is exotic, and all of it is why the pillar costs what it costs: unlike metrics, which keep a bounded number of counters, the log keeps the raw event. The raw event does not compress into fewer records just because the fleet grew.
The honest economics are per-shape and per-value, the same budgeting the hub’s table set out. Sample the healthy: the ten-thousandth successful checkout adds nothing the previous nine thousand did not. Volume-based sampling keeps the pipeline affordable without touching the anomalous. Keep the exceptions whole (errors, security events, the WARN-and-above stream) because those are the lines the postmortem will need. Tier the retention: hot and searchable for the incident window, cooler and cheaper for the compliance window, gone when no question remains that could reach them.
Two failure modes close the section. The first is the aggregation that outlives its schema: fields renamed mid-fleet, so the same query means different things across months; the fix is treating the field schema like an API, versioned and migrated deliberately. The second is the aggregation nobody queries: storage kept out of habit, retention set to infinity, the bill growing. Nobody ever had to defend the line item. Retention is a design decision with a number attached, and the number should be written down next to the reason it was chosen.
What the record is for: the debugging half of every incident
Every incident has two halves, and the log owns the second. The first half is noticing (a metric crosses, an alert fires, a breaker opens somewhere) and that is metrics‘ territory. The second half is diagnosing: what exactly happened, in which instance, under what conditions, for which tenant, in front of which error message? The record answers that, which is why the hub called it “the record that turns an alert into a diagnosis.”
The diagnostic pattern that makes logs irreplaceable is correlation: one identifier (the request ID, threaded from the gateway through every service and every async hop) lets one query reconstruct one journey. Without it, the same journey is archaeology. The archaeology is not metaphorical: the on-call engineer greps each service’s storage in turn, hoping the timestamps align, reconstructing the story from scattered chapters. The correlation ID is cheap at write time and priceless at read time.
The discipline of carrying it (on the event envelope in event-driven fleets, on every step of a saga, through the queue, across the network) is the single highest-return habit in this entire pillar.
Design details that matter
Two standing duties come with the record. The first is reading the dead letter queue: “not a safety net, it is an outage with a delay,” and the queue’s contents are precisely logs of messages nobody could process; a fleet that reads them regularly has early warning, a fleet that reads them after the outage has a timeline. The second is the audit trail: the security-sensitive and compliance-sensitive events (who changed what config, who accessed what record, what deploy was live when) are log lines with a longer retention than the rest of the record.
Often a separate access policy, because their readers are auditors and their questions arrive months later.
The boundary with the journey is worth restating. It is the pillar’s honest limit: the log says what each hop saw, in order but not in relation. It cannot attribute 840 milliseconds of a 900-millisecond request to one downstream call the way a trace can. It was never meant to, per-request causality is the trace’s job. The log’s job is the full detail of the events themselves, kept queryable, joined by the identifiers the schema promised.
Fleet, incident, and audit all end at this record; the trick is building it so the ending is a query and not a dig.
FAQ
What is the difference between structured and unstructured logging? Shape. An unstructured line is prose: readable once, greppable with luck, joinable never. A structured entry is a record of named fields, so filtering, joining, and alerting become queries instead of regexes. The content can be identical; what changes is whether a machine can ask the record questions without first guessing the author’s grammar.
Where should services write logs, to files, stdout, or a service? To stdout or a local file, and let a per-host agent do the shipping. The application’s job ends at a fast, bounded local write; making the app call a logging service synchronously turns the record into a network dependency. The fleet’s worst log gap becomes the bad day, exactly when dropping records loses the evidence. Write locally, ship asynchronously, buffer at the shipper.
How much do log levels matter in production? More than they look: levels feed the counters. Error-rate dashboards, alerts, and canary abort criteria all sum lines by severity. A fleet where ERROR means “the author felt strongly” is a fleet whose shipping signals are noise. The contract worth enforcing is one sentence long (ERROR means a human should look) and it is the difference between a level taxonomy and a suggestion box.
What should never go into a log line? Secrets and payloads: passwords, tokens, keys, card numbers, raw request bodies. Log the identifiers, not the contents: user ID, not user; order ID, not order. The record outlives the incident and often outlives the compliance window. A log store that cannot be audited safely cannot be kept long enough to be useful. Exclusion is a design decision made once, at the schema.
Related articles
- Next read: metrics, series part 3: the other half of every incident: golden signals, RED and USE, time series data, and the alerting discipline that the record’s levels feed.
- distributed tracing, series part 4: the journey: spans, context propagation, OpenTelemetry, and sampling, for the per-request causality the log leaves unspoken.
- monitoring and observability, the hub of this series: the vocabulary, the four-stage pipeline, and the comparison table that says which pillar answers which question.
- message queues, the dead letter queue whose contents are this record’s standing chore: read them regularly, or read them in a postmortem.
- event-driven architecture, correlation identifiers on the event envelope: the difference between following a flow and excavating one.
- API gateway, the tier that sees every call: request logs, latency metrics, and tracing context recorded at the fleet’s front door.
- idempotency, the consumer-side twin of at-least-once shipping: duplicates tolerated as a nuisance instead of feared as corruption.
Share this:

Related articles
HTTP/2 vs HTTP/3: Multiplexing, QUIC, and Real-World Performance
HTTP/2 vs HTTP/3 compares streams, head-of-line blocking, and QUIC so you can pick a protocol that stays fast…
Microservice System Design
Executive Summary: Splitting a monolith into services without design discipline trades one problem for distributed complexity. I cover…
Semantic Versioning in Practice: Breaking Changes, Deprecation, and Trust
Semantic Versioning in Practice shows how you mark breaking changes, deprecate old APIs, and keep the trust of…
We switched to structured JSON logs last year and grepping became almost useless, which was weirdly the point.
Curious how you pick retention for high-volume services without the bill exploding?
Correlation IDs saved us more than fancy dashboards ever did. Still feel like half our services forget to pass them.