Distributed Tracing: Following One Request Across Many Services
What is distributed tracing: the span and trace model, context propagation across services and queues, OpenTelemetry tracing and vendor tools, and the sampling that makes it affordable; the pillar that answers "where did the time go?"

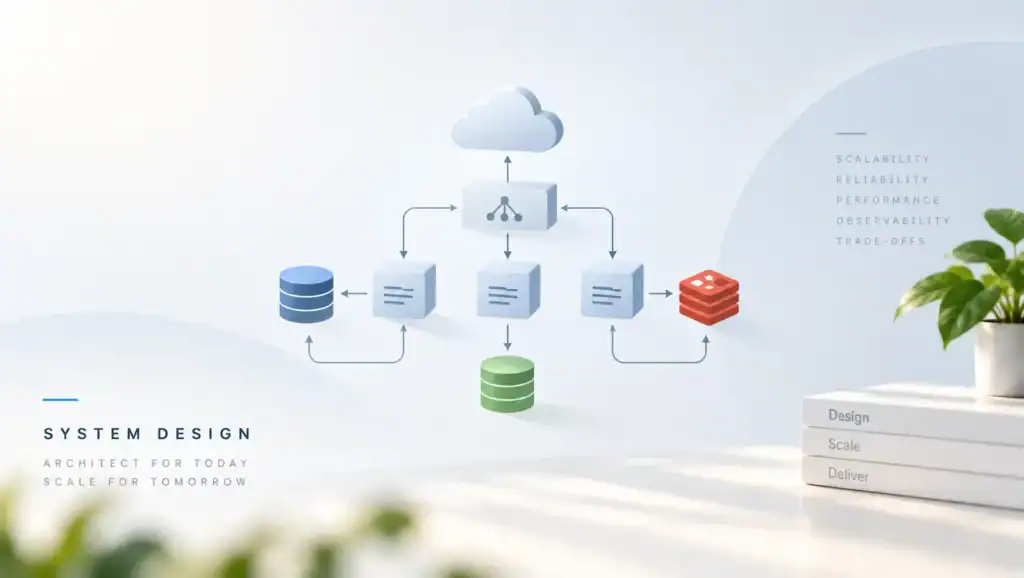
Distributed tracing is the practice of recording one request’s path through a distributed system as a tree of timed spans (each hop an operation with its own start, end. Context) so the whole journey can be replayed after the fact: who called whom, in what order, and where the time went.
The boundary with the hub stays as the overview drew it: that page owns the vocabulary, the pipeline. The single table that says which pillar answers which question; this page owns the journey. The sibling lines are the series’ cleanest division: metrics count the fleet, logs record each event. The trace reconstructs one request; the per-request causality neither other pillar can carry. This is also the series finale, and its Next read hands back to the hub rather than onward: the overview is where the three pillars meet.
What is distributed tracing
As a result, the problem is arithmetic across machines. A checkout request crosses the gateway, an ordering service, a queue, an inventory service, a database, and a payment provider: six hops, each with its own local clock and its own local view, and no single machine that ever sees the whole path. Metrics report that checkout’s p99 is 900 milliseconds; logs name the errors each hop saw. Neither can say what one specific slow request experienced or where its time went. The answer is a property of the journey, and no hop owns the journey. Distributed tracing closes exactly that gap.
The mechanism is instrumentation at every hop. When a request enters a service, the tracing library starts a span, a timed record of one operation: when it started, when it ended, what service performed it, what status it returned. The attributes that name the work (endpoint, queue, method, tenant). The child calls the service makes each open their own child spans, parented to the one in progress. The assembled result is a trace: a tree of spans whose shape is the request’s call chain, whose timing is the request’s latency budget itemized.
Whose failures mark the exact hop where things went wrong. Read as a waterfall (each span a bar, nested by parentage) the trace is the one artifact in the whole telemetry pipeline that shows the 840 milliseconds inside the 900: which downstream call, on which branch, in front of which attribute.
How this plays out in practice
In contrast, what that buys is a category of answers the other pillars cannot give at any price. Attribution: where a slow request’s time went, hop by hop. Topology: who actually calls whom in production; the trace data is an honest map of the fleet’s real call graph, often the first accurate one a fleet has ever seen. Fault localization: which hop errored, from the outside in, without grepping five services in sequence.
Per-request causality: the answer to the tracing question event-driven architecture left (“which subscriber, reacting to which event, dropped the ball”) as a tree instead of an archaeology dig.
The honest costs come with the category. A trace per request is a record per request, more volume than a fleet can usually afford to keep whole, which is why sampling is a first-class subject in this discipline rather than an afterthought. The instrumentation must be carried by every participant, or the tree grows gaps: an uninstrumented hop becomes a span-less segment of time. The attribution silently degrades into inference. And the context that binds the spans must survive every boundary (process, network, queue) which is the discipline’s true hard problem, and the next section’s subject.
Spans and traces: the data model
As a result, the span is the atom of tracing, and its fields are deliberately few. Identity: a span ID unique to the span, and a parent reference to the span that caused it. Timing: a start and an end; duration is derived, never written, because clocks drift and durations must survive the drift. Description: the operation’s name and the service that performed it. Result: a status; unset, ok, error, because a span that fails without recording it poisons the whole tree’s story.
Context: attributes; key-value pairs naming the work (endpoint, queue, method, tenant, shard), plus point-in-time events on the span’s own timeline. Links to other traces when one operation legitimately belongs to two stories, as with queue consumers whose work was caused by an earlier publish.
The trace is the tree, and it is held together by two identifiers. A trace ID is minted at the request’s entry point and carried unchanged to every hop; a span ID names each operation, and the parent references chain the spans into the shape of the call. The trace ID is the correlation identifier the rest of the fleet keeps re-discovering under other names: the request ID in the access log, the correlation ID on the event envelope, the identifier threaded through every saga step.
Trade-offs worth weighing
In contrast, distributed tracing is that discipline, formalized: one ID minted once, propagated everywhere, and the journey becomes one record instead of an agreement among strangers.
The reading discipline is the waterfall: spans as bars, nested by parent, laid on a common timeline. The parent’s bar spans its children; a child that stretches to the edge of its parent found the constraint; a gap between children is the parent’s own work; a wide child with narrow grandchildren points at the child’s downstream, not its internals. Two views of the same tree cover the fleet’s two questions: the per-trace waterfall for “what happened to this one request,” and the aggregate over traces for “which endpoints are slow and which downstreams are the reason”, the fleet view that turns trace data into a service dependency map with real latencies attached.
Context propagation: the hard part
As a result, the tree only exists if the context crosses every boundary, and this is where tracing programs succeed or quietly fail. Across an HTTP hop, the trace context travels in headers (the W3C Trace Context standard defines the fields. The mainstream libraries and platforms speak it) so the callee can parent its first span to the caller’s current one. Inside a process, the context rides the library’s call-stack bookkeeping, which is why spawning work onto a thread pool or a background task needs explicit propagation or the tree forks into fragments.
The async boundaries are the honest difficulty, because the queue is where context goes to die. A synchronous call carries headers; a message written to a queue today and consumed minutes later carries only what the publisher put in the envelope. The fix is the one event-driven architecture already named: correlation belongs in the event envelope from the first publish; trace context included, so the consumer’s spans parent to the producer’s, and the journey stays whole across the pause. The same applies to scheduled jobs, retries.
Failure cases to expect
Every hand-off where no live request exists to carry the context implicitly: the context must be made a field of the work, not a property of the connection.
What breaks propagation breaks the trace. The failure is visible only later: a trace that ends at the queue, a subtree that appears with no parents, a journey in two fragments that no query will rejoin. The defensive practice is a propagation audit as part of onboarding any new hop (does the library inject and extract the standard headers, does the queue wrapper carry the envelope, does the thread pool hand the context across). A fleet’s traces are exactly as whole as its most careless boundary.
OpenTelemetry tracing
OpenTelemetry tracing is the instrumentation standard the industry converged on: a vendor-neutral API the application calls, an SDK that batches and exports what the API emits, wire formats like the W3C Trace Context headers for the boundary crossing. Semantic conventions that agree on names, what http.method means, what a queue span is called, which attribute names a database span carries. The standard exists precisely because instrumentation is the expensive half of tracing to redo: it lives inside every service’s code. The fleet that writes it against a vendor’s proprietary agent has married the vendor’s backend by other means.
The strategic shape of the ecosystem (OpenTelemetry versus vendor tools) is therefore not a contest but a division of labor. OpenTelemetry owns the emission: the API, SDK, propagation, and conventions, maintained as an open standard with broad vendor support. Vendors own the consumption: the trace backends that store span trees, the query engines, the waterfalls, the analytics. A fleet that instruments with the standard can change its backend without touching services (the export is a configuration concern, not a codebase rewrite) and can run different tools for different jobs. The standard is the contract between them.
Design details that matter
The honest caveats are adoption cost (the API surface is large. Conventions evolve) and completeness (a standard cannot instrument a third-party library that never adopted it; the gaps are the fleet’s to audit).
Where the standard ends, the discipline from the rest of this series continues: the trace ID is the correlation identifier, minted at the entry point (often the gateway, the tier that sees every call) and carried everywhere the hub’s context rule demands. Adopt the standard for the emission, keep the context whole across every boundary, and the backend question stays a purchasing decision instead of an architecture one.
Sampling: which requests to trace
A trace per request is a record per request. At fleet scale that is log-scale volume wearing a smaller name, which is why sampling is a design decision with the same status as instrumentation itself. Head-based sampling decides at the trace’s start, from a fixed rate: a percent of journeys recorded whole, the rest recorded not at all. It is cheap, uniform, and honest about its blind spot: at one percent, a rare failure that happens to strike an unsampled request leaves no journey behind. The interesting requests are precisely the rare ones.
Tail-based sampling decides at the trace’s end, when the journey’s story is known: keep every trace that errored, every trace that exceeded a latency threshold, every trace that touched a flagged tenant or endpoint. Sample only the healthy and ordinary to a small rate. It is the honest preference of incident-minded teams (the evidence the postmortem needs is exactly the evidence tail sampling keeps by design) and it is more expensive to build: the collector must buffer each complete journey long enough to judge it. Tail sampling lives at the aggregation tier with the journeys in flight.
Operational realities
The composition most fleets actually run is both: head-based for the healthy majority, tail-based rules overriding the coin flip whenever a journey turns out interesting: errors kept whole, slow requests kept whole, the anomalous never sampled away. The budget conversation is the same one the hub’s table set for every pillar: traces keep per-request context by construction, pay for it in volume. Spend the volume budget where the questions come from. A fleet that keeps every trace is paying log-scale bills for trace-scale answers; a fleet that samples without keeping the anomalies has built a museum of ordinary journeys.
FAQ
What is the difference between a span and a trace? A span is one operation’s record: one hop, with a start, an end, a name, a status, and attributes. A trace is the tree of spans for one request, chained by parent references and joined by a shared trace ID. The span is the fact; the trace is the story. A slow span names a suspect; the slow trace convicts one.
Do we need tracing if our logs already carry correlation IDs? Correlation IDs are the workable substitute, and the prerequisite. They let one query line up a journey’s chapters in order. What they cannot give is the relationship and the timing: which call was inside which, what each hop’s duration was, where the request’s budget actually went. If the fleet is small and the chains are short, IDs in logs cover a surprising amount; from the moment call chains cross services and queues, the trace is the version of the same discipline that carries its own clock.
Does distributed tracing add latency to requests? A little, and none of it where it hurts: starting spans and stamping headers is local bookkeeping measured in microseconds. The export of finished spans is asynchronous, off the critical path, batched to the collector. The cost that needs managing is not latency but volume, which is what sampling budgets exist for. The overhead conversation that matters is the propagation audit: the boundary you forgot to instrument is not costing latency, it is costing visibility.
Why do my traces break at the queue? Because the queue is an async boundary, and trace context only crosses an async boundary if it is carried as data. A synchronous hop propagates through standard headers automatically; a message published today and consumed later carries only what the publisher put in the envelope. The fix is always the same one event-driven architecture named: correlation (trace context included) belongs in the event envelope from the first publish. The consumer’s spans parent to the producer’s and the journey survives the pause.
Related articles
- Next read: monitoring and observability, the hub this series grew from: the vocabulary, the telemetry pipeline, and the comparison table that says which pillar answers which question: the start of the series, for readers who arrived at the end.
- logging, series part 2: the record that names each event this pillar attributes: structured logging, log levels, and the aggregation pipeline.
- metrics, series part 3: the counts that notice the trend this pillar explains: golden signals, RED and USE, and the alerting discipline.
- event-driven architecture, the correlation-ID discipline in its natural habitat: the event envelope that keeps flows followable across subscribers.
- saga pattern, the correlation discipline applied to long-lived transactions: identifiers threaded through every step and compensation.
- API gateway, the tier that sees every call and the natural entry point: where the trace ID is minted and the access log is richest.
- message queues, the async hops this article keeps meeting: dead letters, redelivery, and the envelopes that must carry context across the pause.
Share this:

Related articles
HTTP/2 vs HTTP/3: Multiplexing, QUIC, and Real-World Performance
HTTP/2 vs HTTP/3 compares streams, head-of-line blocking, and QUIC so you can pick a protocol that stays fast…
Microservice System Design
Executive Summary: Splitting a monolith into services without design discipline trades one problem for distributed complexity. I cover…
Semantic Versioning in Practice: Breaking Changes, Deprecation, and Trust
Semantic Versioning in Practice shows how you mark breaking changes, deprecate old APIs, and keep the trust of…
We finally got OpenTelemetry spans across our queues last month and the “where did the time go” bit clicked hard.
Does context propagation through Kafka headers still break a lot for people, or is that mostly solved now?