- Observability
- System Design
- alert fatigue
- burn rate
- on-call load
- page versus ticket
- runbook
- symptom alert
Alerting That Works: Signal, Noise, and On-Call SLOs
Alerting That Works pages you for real user pain, not every small blip. Learn how to cut noise, tie pages to SLOs, and keep on-call load sustainable now.

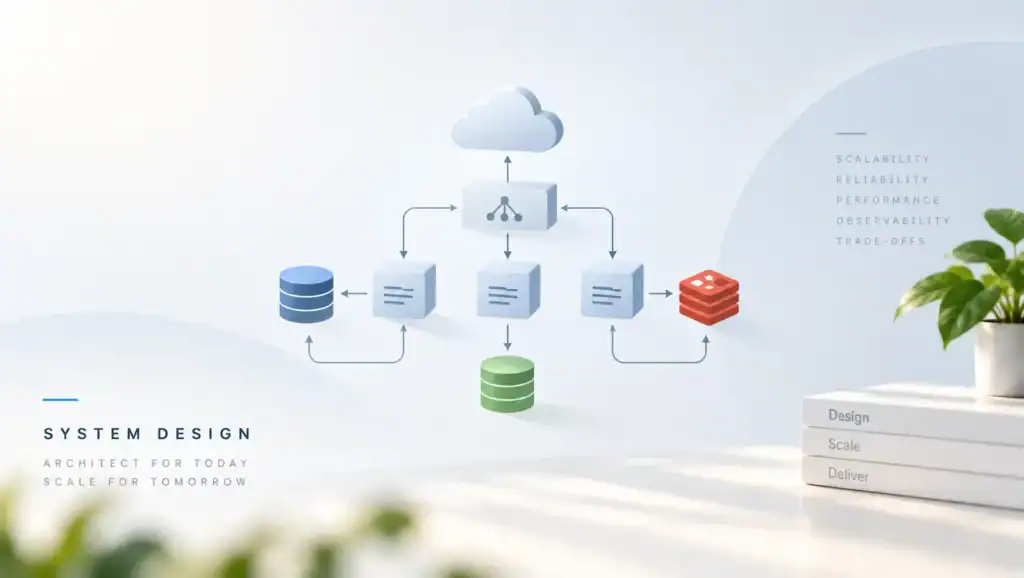
Alerting That Works pages a human only when a user is in pain or pain is about to start. Everything else can be a ticket, a chart, or a log. If you page on every blip, people mute the channel. Then the real incident waits while the team sleeps through it.
What It Is and Why It Fails
An alert is a request for attention. A page demands a person now. A ticket can wait for the next work day. The failure mode is mixing those two.
CPU at 80 percent is not a page. A checkout error rate that will burn the monthly budget in hours is a page. The difference is user impact and time to harm.
Noise has a simple cause. The threshold is tighter than the normal wobble of the metric. A common mistake I have seen is a page on a five minute error spike that self heals.
The person wakes up, sees a green chart, and learns to ignore the phone. After enough nights, the next true outage is ignored too.
Missing alerts are the other failure. You paged on causes, such as a single host, and missed the symptom, such as all hosts failing the same call. Prometheus alerting guidance pushes you to alert on symptoms.
I agree. Causes belong in the runbook, not in the first page.
On-call load is a product of the alert set. If two people share a week and each night has several pages, you do not have a hero culture. You have a design bug.
Treat page volume as an SLO for the team. When that budget burns, stop adding alerts and delete some.
Symptom, Cause, and Saturation
Symptom alerts answer a user question. Are requests failing? Are they slow? Is data late?
Cause alerts answer where. Disk full, deploy stuck, certificate near expiry. Saturation alerts answer how close you are to a cliff. Queue age, pool wait, and remaining file handles belong there.
Page on symptoms that break an objective, and on saturation that will break it soon. Ticket the slow causes. A disk at 70 percent can wait until morning if growth is smooth.
A disk that will fill during the peak cannot. Therefore the same metric can be a ticket or a page, depending on the time left.
SLIs explained in plain terms should be the input to the page. If the indicator is not tied to user pain, do not wake anyone for it. A high CPU with a healthy latency SLO is a chart for later. It is not a phone call.
On-Call as an SLO
Give the rotation a budget. An illustrative production range is a handful of pages per person per week, not a handful per night. Also track time to acknowledge and how often the page was a false alarm. If false alarms dominate, the alert is broken even if the metric is real.
Write a rule for what may page at night. User-facing errors, data loss risk, and a hard dependency down are in. A single canary host, a batch job that can retry, and a dashboard gap are out.
When you are unsure, default to a ticket. You can promote it after you see real harm.
Architecture and Implementation
The pipeline is short. Metrics or logs become a rule. The rule has a duration, a severity, and a label set.
Then a router sends pages to the current primary and tickets to a queue. If the router is clever and the rule is vague, you still get noise. Start with boring rules.
Alerting on SLOs uses burn rate. A fast burn pages quickly because the monthly error budgets will be gone in hours. A slow burn opens a ticket because you will miss the objective this month if nothing changes.
You need both. One threshold cannot see both speeds.
Multi-window checks cut false pages. Require the burn to be high over a short window and a longer window. A one minute blip fails the short window only, so it does not page. A real outage fails both.
This is the pattern I use for user-facing APIs. It needs a decent event rate. Low traffic services need a longer window or they flap.
Route by service and by severity. The primary gets pages. A secondary gets them if the primary does not ack in a few minutes.
Tickets go to the owning team, not to a shared black hole. Include a link to the chart, the SLO, and a short runbook. A page with no next step wastes the first ten minutes.
A Simple Severity Map
- Page when a fast burn will exhaust the monthly budget in a few hours.
- Page when a hard dependency fails health checks and users are blocked.
- Ticket when a slow burn will miss the objective by the end of the window.
- Ticket when saturation is high but the SLO is still inside the budget.
- Log only when a host flaps and the service SLO stays healthy.
- Review every page the next week and delete or retune the noisy ones.
Trade-offs You Should Name
Sensitive alerts catch harm sooner and wake people more often. Dull alerts protect sleep and let a slow burn run. A single global channel is easy and becomes unread.
Per-team routing is clear and costs more setup. Choose the trade with the on-call SLO in mind, not with the number of rules you can write.
| Style. | Best fit. | Main risk. | Human cost. |
|---|---|---|---|
| Fast burn page. | User-facing SLO. | Noisy if traffic is tiny. | Rare, urgent. |
| Slow burn ticket. | Gradual decay. | Ignored if the queue is huge. | Daytime work. |
| Cause page. | Clear, rare failures. | Misses unknown causes. | Often too high. |
| Saturation ticket. | Capacity planning. | Too late if the cliff is sharp. | Low, until it is not. |
Inhibit rules are part of the trade. If the edge is down, do not page for every downstream timeout. One parent page is enough.
Although inhibit rules can hide a second fault, a storm of child pages hides it too. Keep inhibit trees shallow. Test them, because a wrong inhibit is a missing page.
Pitfalls and Failure Modes
Most bad on-call weeks come from alerts that cannot be acted on. The page fires, the runbook says to look at a chart, and the chart is green by the time you open it. If a human cannot do something useful, the alert should not be a page. Retune the duration or drop the severity.
- Paging on a threshold with no duration, so every scrape blip wakes someone.
- Alerting on average latency, which hides a slow tail the users actually feel.
- Leaving a test alert routed to the production page channel.
- Building a runbook that is a link to another link, with no first command.
- Counting every container restart as a page even when the service is healthy.
- Never deleting an alert, so the set only grows after each incident.
Health checks are not the same as user alerts. A failed local probe should pull a pod out of rotation. It should page only when enough pods fail that users suffer.
We once hit a bottleneck when probe failures paged the whole team while the load balancer had already failed over. The users were fine. The phones were not.
Silence and mute are failure modes too. A long silence hides a deploy. A mute that never expires hides a known bug until it becomes an outage. Put an expiry on every silence.
Require a ticket id. Review silences in the weekly ops meeting. If a silence is permanent, delete the alert instead.
Low traffic needs care. A handful of errors can look like a huge rate. Require a minimum event count before a burn alert fires.
Otherwise a quiet service pages all night on two failed calls. For those services, a longer window or an absolute error count is more honest.
A Rule You Can Start From
The example below is an illustrative fast-burn style rule. It is not a copy of a vendor default. It pages when the error ratio is high for ten minutes and the service has enough traffic to trust the ratio.
Pair it with a slower ticket rule. Do not ship the fast rule alone.
groups:
  - name: checkout-slo
    rules:
      - alert: CheckoutFastBurn
        expr: |
          (
            sum(rate(http_requests_total{service="checkout",code=~"5.."}[10m]))
            /
            sum(rate(http_requests_total{service="checkout"}[10m]))
          ) > 0.02
          and
          sum(rate(http_requests_total{service="checkout"}[10m])) > 1
        for: 5m
        labels:
          severity: page
        annotations:
          summary: Checkout errors are burning the SLO fast
          runbook: checkout-slo
Point the runbook label at your own internal doc. The important parts are the duration, the minimum rate, and the page severity. SLOs for backend engineers should define the two percent line, not a random guess. If you do not have an SLO yet, do not invent a tight threshold to look serious.
After the first week, count pages, false alarms, and time to ack. If the fast rule never fires, you may be blind, or you may be healthy. Check the slow burn before you relax.
If it fires every day, the threshold or the window is wrong. Change one thing at a time so you know what helped.
Performance, Scale, and Cost
Alert evaluation is cheap next to the harm of a bad page. Still, a rule that scans a huge label set can lag. The page then arrives after the incident moved.
Keep alert metrics low in cardinality. One series per service and route class is enough. Per-user series do not belong in a page rule.
The cost you should track is human time. Minutes awake, minutes to mitigate, and pages that ended with no action. That is the real price of the alert system.
A cheaper pager plan will not fix a noisy rule. Delete the rule.
At scale, duplicate alerts from many clusters become the outage. Deduplicate on service, region, and symptom. One page should say the blast radius.
Ten pages that each name one pod force the human to build the picture while users wait. Aggregation is a feature, not a loss of detail. Put the detail in the chart.
Also plan for the alert pipeline to fail. If the metrics store is down, you need a second path for a few critical symptoms, or you will be silent during the worst hour. A simple black-box probe from outside the cluster can page when the main stack cannot. Keep that set tiny so it stays trustworthy.
Key Takeaways
- Page on user symptoms and on fast SLO burn, not on every cause.
- Use a second, slower rule as a ticket so gradual decay is still visible.
- Require duration and a minimum event rate before a page can fire.
- Give every page a runbook with a first action.
- Cap on-call load, and delete alerts that do not earn their pages.
- Expire every silence, and review false alarms every week.
FAQ
How many pages a week is too many?
If nights are breaking most weeks, it is too many. An illustrative range is a few actionable pages per person per week. The exact cap is a team SLO. When you exceed it, pause new alerts and remove the noisiest rule before you add anything.
Should CPU ever page?
Only when CPU saturation is about to break the user SLO and no autoscaler will save you in time. Most CPU charts belong on a dashboard. If latency is fine, a high CPU is a ticket at most. Let the symptom page, then use CPU in the investigation.
What belongs in the runbook?
The first check, the rollback or mitigation, and who to call if the blast radius is wide. Link the SLO chart and the recent deploys. Do not paste a novel. A runbook that takes longer to read than the mitigation is a sign the alert is vague.
How do you alert when traffic is low?
Do not trust a ratio built on a few requests. Add a minimum count, lengthen the window, or alert on a sustained absolute failure. For a job that runs hourly, alert when it misses a deadline, not when a one minute ratio spikes. Low traffic needs a different shape, not a tighter threshold.
Export last month of pages. Mark each as acted, duplicate, or false. Delete or retune the false ones before you write another rule.
Then add one fast burn page and one slow burn ticket for your most important user path. Review them after one week against the on-call budget, and keep only what a human can act on.
Share this:

Related articles
HTTP/2 vs HTTP/3: Multiplexing, QUIC, and Real-World Performance
HTTP/2 vs HTTP/3 compares streams, head-of-line blocking, and QUIC so you can pick a protocol that stays fast…
Microservice System Design
Executive Summary: Splitting a monolith into services without design discipline trades one problem for distributed complexity. I cover…
Semantic Versioning in Practice: Breaking Changes, Deprecation, and Trust
Semantic Versioning in Practice shows how you mark breaking changes, deprecate old APIs, and keep the trust of…
We cut pages by half after tying alerts to SLO burn rate instead of raw CPU. On-call is almost human again.
Symptom alerts over cause alerts — still fighting that culture fight on my team.